")
")

In Excel, we can draw data from different databases using SQL codes, process this data as we like and move them to our reports in Excel pages. In this way, we can perform detailed reports with the flexibility of Excel.
In addition, Excel has a very powerful reporting feature such as pivot table. By using pivot table tool, we can do automatic data sorting, calculating, merging and total acquiring; and we can make reporting in another page with the revealed summarized information. At the same time, we can use other functions of Excel, decorate it with visual features, create pivot tables and report from a large amount of data.
Report Samples with Pivot table
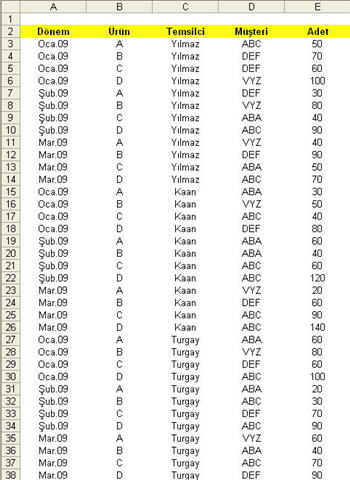
In the sample table displayed below, sale amount and detail information about the A, B, C and D products of a company is recorded as raw data.
Below, you can see some of the report samples that can be prepared with the data recorded in that table.
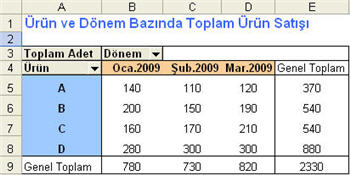
Periodical sale amount of products:
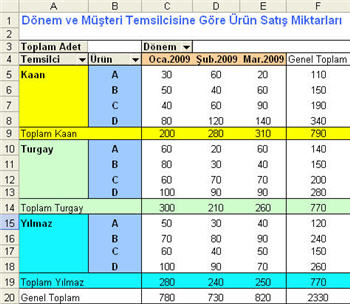
Sales amount by Period and Agent:
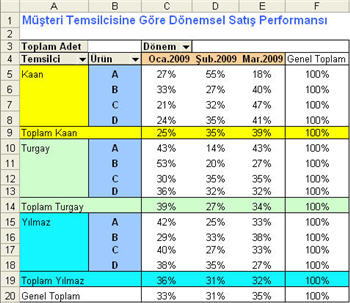
Periodical sales performance by customer representative:
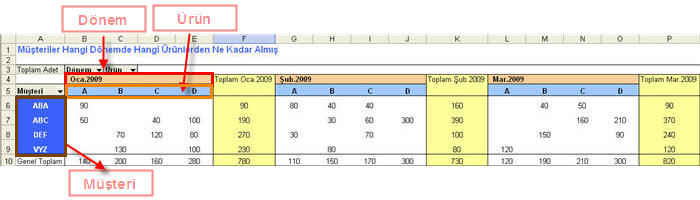
Products customer buy by period:
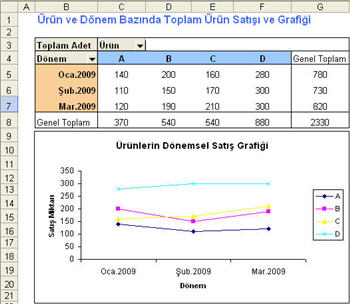
Total product sales by Product and period and the pertaining graph: